Let’s say you are a real estate agent in Seattle looking for an algorithm to predict the home prices.
For the Module 1 Project, I worked with a given data set of King County, Washington house sales. The objective was to find out which features, such as the number of bedrooms, whether it’s a waterfront property or the square footage of the living space, were good predictors of what the sale price would be.
I created the predictions using linear regression.
In this post, I’m going to share the process by which I selected the features for applying the model to. I based my process for feature selection on this post.
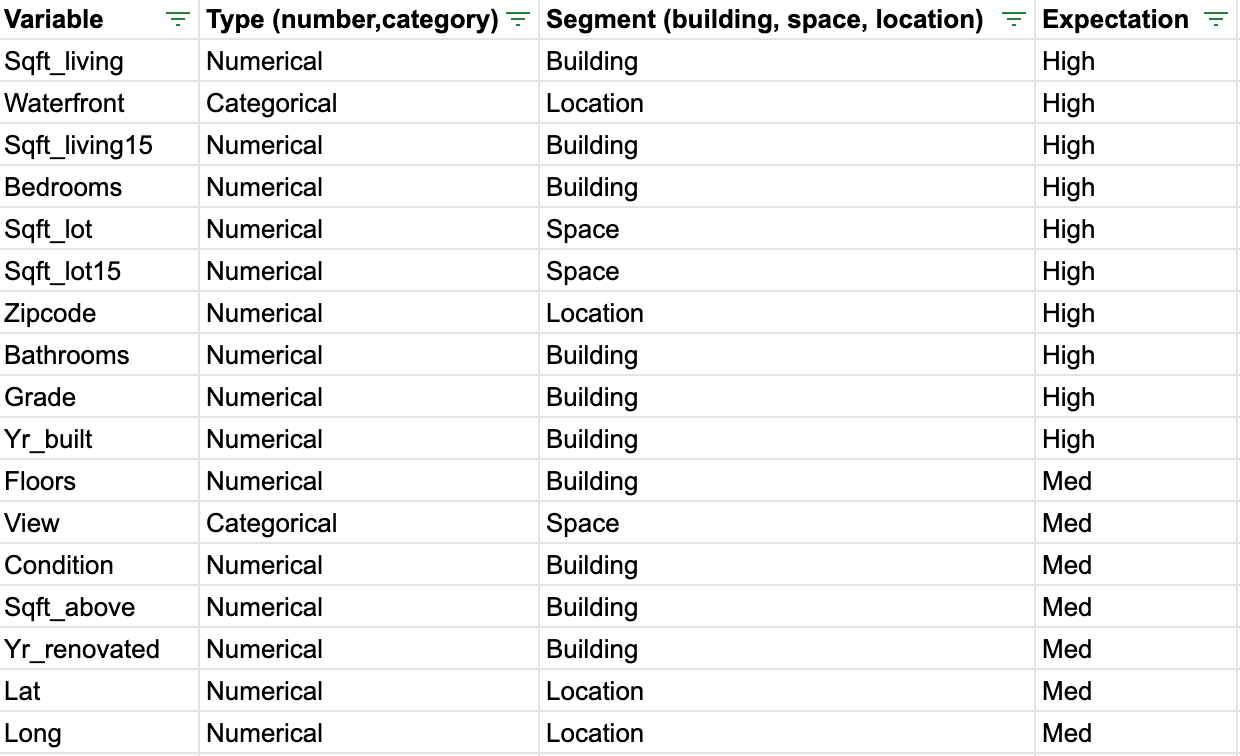
First, I created a table of all of the features listed in the given data set and what my expectation was for them predicting sale price.
After cleaning the data, but before creating the linear regression models for predictions, first I explored the data for correlations. I explored the variables that I thought had a high expectation of predicting price using histograms and box plots. Through this, I found that sqft_living, sqft_living15, waterfront & view have a high correlation with price.
Then I did a correlation matrix heatmap to confirm a correlation between these variables and price:

As you can see here sqft_living, grade, sqft_above, sqft_living15 and bathrooms all had correlations with price that were .5 and higher.
Finally I created a set of scatter plots with those highly correlated variables:

All the features listed show strong positive correlations with price.
Once it came time for OLS regression between continuous dependent and independent variables I was looking for those that had higher r-squared values and low p-values. R-squared is the coefficient of determination which means that it shows the baseline, or worst model. R-squared values reveal whether your model does better than that baseline. The higher the number the better the fit. P-values show the significance of that feature making a prediction, the lower the p-value the the greater the significance.
Here’s what was returned after running the algorithm:

Again this confirmed what the scatter plots showed above, all of these variables show r-squared at above 0.1 and p-values of 0.
While I did complete a log transformation on the target variable (price) I ended up sticking with the original data which had higher r-squared values.
Next up was looking at the categorical variables - waterfront and view so I ran an OLS regression on these. Waterfront had an r-squared value of 0.004 and view had one of 0.082.
Taking all this into account the following features had the highest r-squared values and p-values of 0 which made them qualified as predictors for our model:
Bathrooms, sqft_living, grade, sqft_above, sqft_living15 & view.

I chose bathrooms, sqft_living, grade and view for my presentation.
Done & done. Ready to pass it off to the bigwigs. Right?
Well, not so fast. While this was a good exercise in practicing the mathematic modeling & programming to create the algorithm there’s a huge missing piece here: is this data useful in real life?
I would say no, the data set given is far too limited to be useful in predicting house sale prices. After all is said and done with this project, I am left to wonder whether bathrooms, square footage, grade, and the view would be the only factors I’d be interested tracking if I were a real estate agent.
What about other features like the style of house (is it a craftsman or a boathouse?), the neighborhood, access to public transportation, or the school district. These are all features that’d I’d be interested in as a buyer, so I’m sure as an agent it would be helpful to see if any of these and numerous other qualitative factors would be useful in predicting the price.
Zillow is a great example of a company that uses this type of modeling to create their “Zestimate” of home prices. They created a video to explain how they do this.
After watching this video it’s easy to see that the big elephants in the room are historical price data of the home, price estimates of nearby homes and taxes. In reality, these three factors alone are what I’d most be interested in to predict the current price if I were trying to sell a home to a client.
So where does that leave us?
Back to the drawing board. The conclusion is you can not just rely on the data that is given to you to make predictions. You need to continue to ask the right questions and go find the data you need to create your hypothesis. You’re not finished just because you wrote the algorithm. You’re only getting started.